Photogrammetry: Linking early-life environment to later-life body size
|
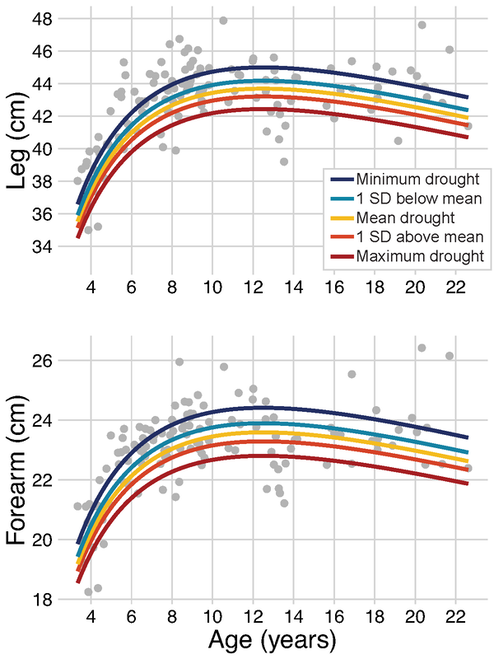
I used parallel-laser photogrammetry to get non-invasive measures of baboon body size. With these measurements, I tested whether early-life and adult environments are associated with body size in wild female baboons. We found that baboons who experienced prolonged early-life drought had shorter legs and arms as adults. However, torso length wasn't affected by drought, and other sources of early-life adversity were not associated with any later-life body size measurements. This project also produced the first estimate of maternal effects and heritability of body size in wild baboons! See here for the published article, which includes the measurement protocol and other helpful docs in the supplement.
The figure to the right shows the relationship between ate (x-axis) and limb length (y-axis) for our study subjects. Each gray dot is the mean body size for a female baboon. The lines are the predicted body sizes, based on our statistical models, under varying amounts of prolonged early-life drought. Duke undergraduates Maggie Pickard and Anna Lee also used these photogrammetry data for their honor's theses on effects of early-life environment on juvenile male body size (Maggie's) and the relationship between female dominance rank and body size (Anna's). |
|
|
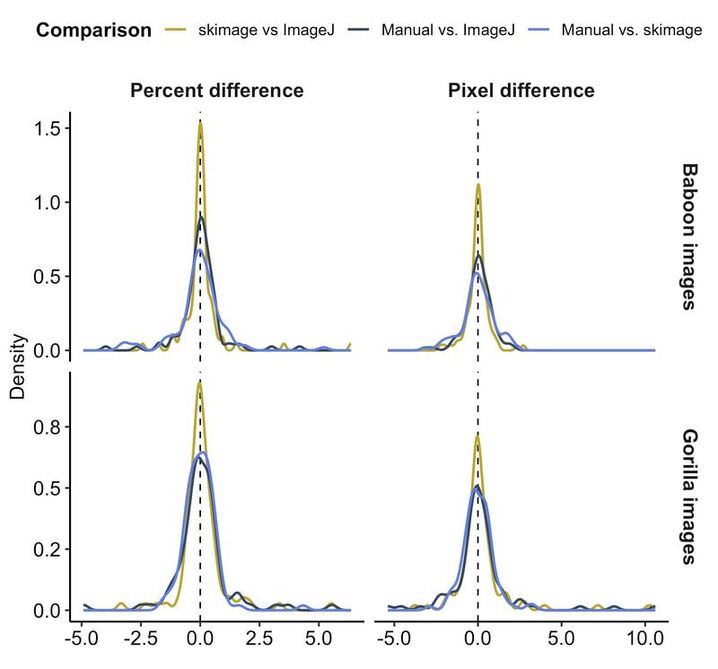
If you're sick of manually measuring lasers, see code here to automate it, and check out our manuscript! I worked with undergrads Riddhi Ranjithkumar, Emma Helmich, and Elise Malone as well as Duke's DataViz wizard Eric Monson to develop an easy method to automatically measure the inter-laser distance in photogrammetry images. Colleagues at George Washington, Jack Richardson, Shannon McFarlin, and Mark Reeves, led a similar charge on their gorilla dataset, with a different approach. This paper presents both methods - the Duke/Baboon/ImageJ method is ideal for smaller datasets and/or drier environments, whereas the GWU/Gorilla/skimage method is ideal for larger datasets and/or more green environments. Both methods do a great job, saving us time and reducing variation in the final body size measure. This figure compares the two automated methods (ImageJ is what we developed at Duke, skimage is what our colleagues developed at GWU) to each other and two manual measurements. We tested the performance of these methods on images of baboons and gorillas, and show the results in terms of percent difference and pixel difference.
|
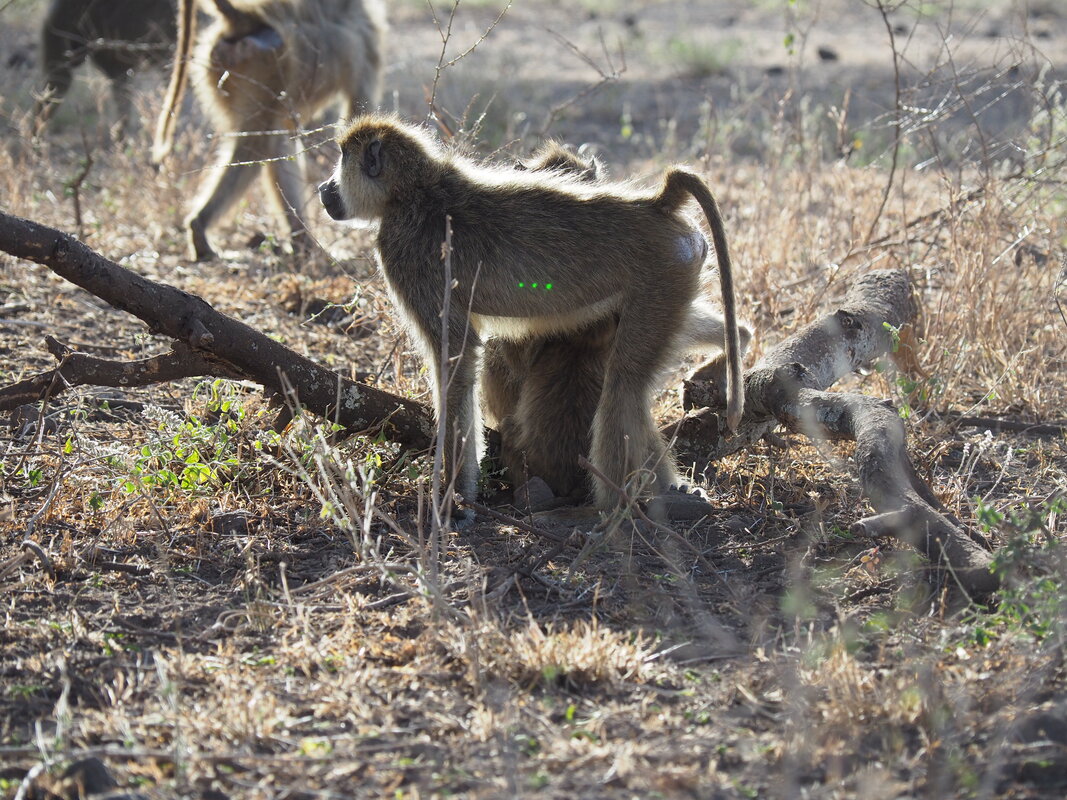
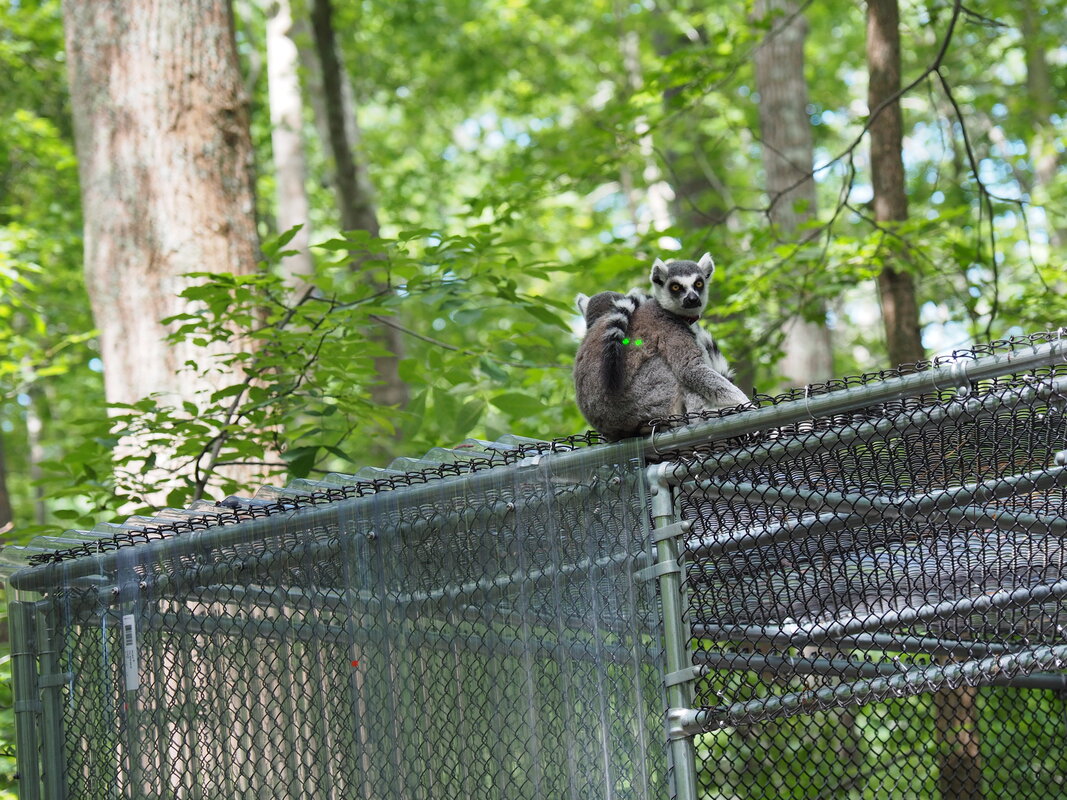
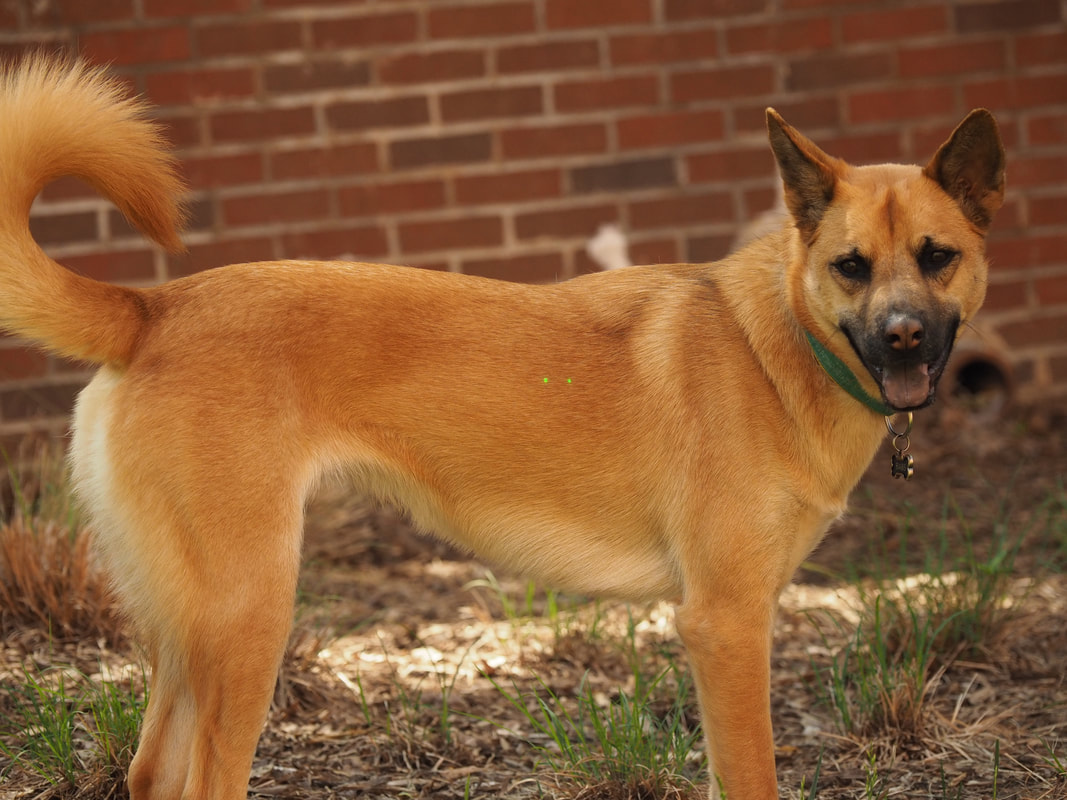
Baboon photogrammetry has involved many other fantastic people. Anna Lee, who completed an Honor's Thesis on baboon body size in 2019, spent 5 months in Amboseli collecting photogrammetry data (quickly exceeding my ability to do so). Shannon McFarlin provided assistance on how to build the parallel-laser device while I was in the field with a broken device. Richard Nappi from the Duke Instrument Shop built the most recent iterations of the parallel-laser device. Riddhi Ranjithkumar created and tested a code to automate the inter-laser distance measure (see link to code above), along with Emma Helmich. Elise Malone and Emma measured photos during our development phase. Sophia Li helped establish our first methods. In addition to help from lots of people, we also had help from lots of non-human animals! Getting this project up and running had Anna and me photographing lemurs at the Duke Lemur Center, taxidermied animals at Bass Pro Shop, and of course my baboon-sized dog, Babs.
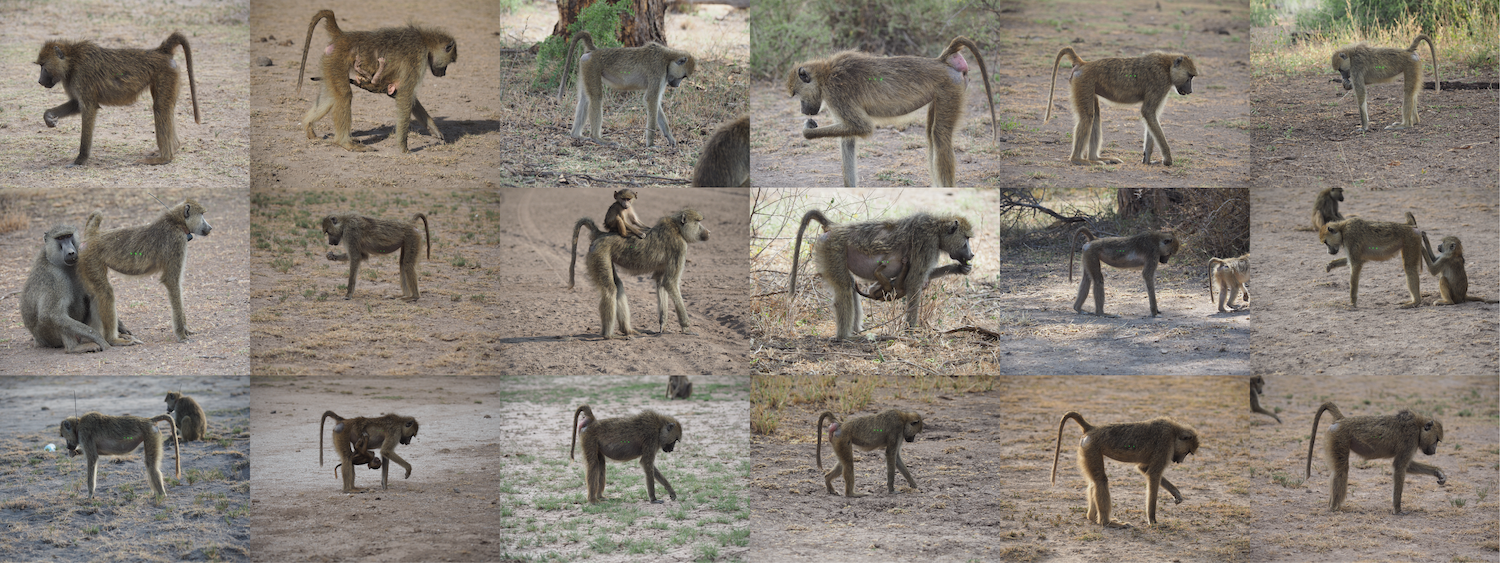
This project also led to a wonderful collaboration as part of Art of a Scientist! I made 'artwork' from our photogrammetry images, and real artists Walsh/Blazing turned our work into this beautiful video about the Amboseli Baboon Research Project. Below is one of my pieces: A photo of every adult female baboon in Acacia's group, ordered by dominance rank (alpha at top left, last-ranking at bottom right).
|
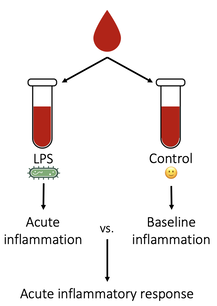
Early-life environment and adult immune function Female baboons who experienced lots of early-life adversity have dramatically shorter lives than females who did not. Could differences in immune function help explain this effect? Testing this question, incorporating prior research from humans into an ecological and evolutionary framework. I'm now using baboon serum samples to test the relationship between early-life adversity and inflammation. Manuscript in prep, and you can read about this study in my Dissertation.
|
Icons from Biorender and Alone forever (Noun project)
|
Photo by Amanda Lea
|
Juvenile male rank acquisition: Early-life factors and alpha female particularity
Aren Kalash completed an honors thesis to investigate the process by which juvenile males ascend in dominance rank over adult females in their group. In addition to investigating early-life factors that predict male rank ascension, she also tested whether alpha females are especially tricky to beat. This is a really fun dataset and project - and I can't wait to share all the findings! Manuscript in prep.
|
Social status: Queens of the hierarchy & a closer look at assumptions
|
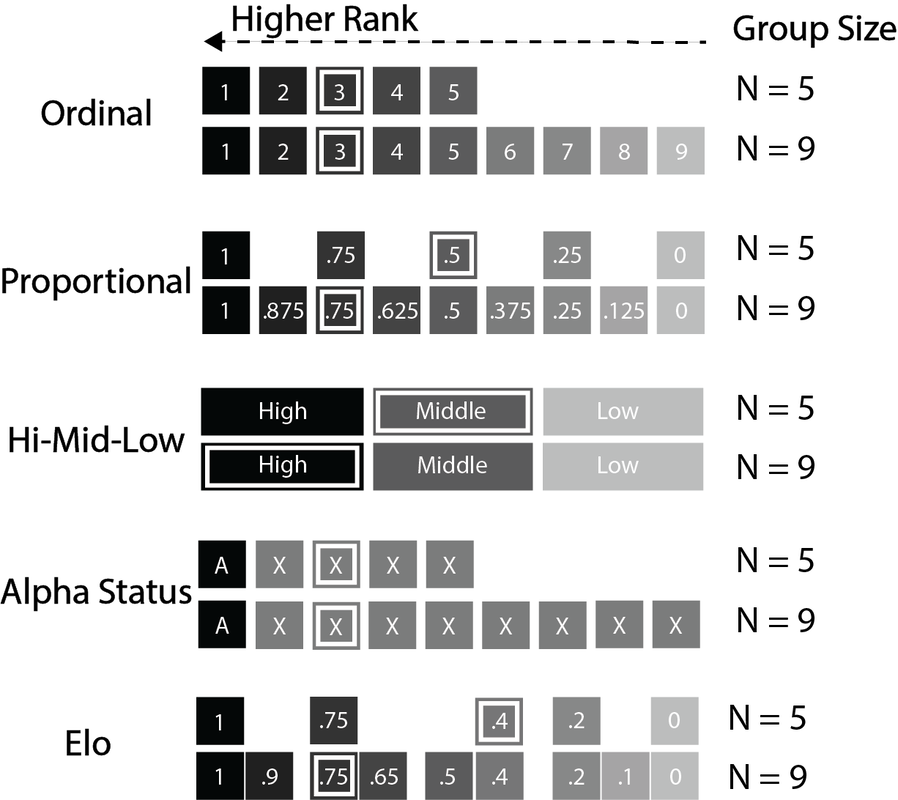
Does HPA axis activity - a proxy for the stressors that we experience - depend on social status? I was extremely lucky to have access to a large dataset of fecal glucocorticoid metabolite measures, which we used to ask whether there's a relationship between rank and glucocorticoid metabolite concentration in wild female baboons. We found that there is - but whether there's a relationship depends on which way you measure rank! Alpha females had lower glucocorticoid levels than non-alpha females. And when using proportional rank - which measures the proportion of the group that a female dominates - we also found that higher-ranking females had lower glucocorticoid concentrations than lower-ranking females. However, our other measures of rank were not associated with glucocorticoid levels. We propose that different rank metrics make different assumptions about how organisms compete for resources within groups. A very simplistic version of this is in the figure - white boxes highlight the 3rd-ranked individual in each group, and higher competitive ability is represented by darker shading. See our publication on this here. |
|
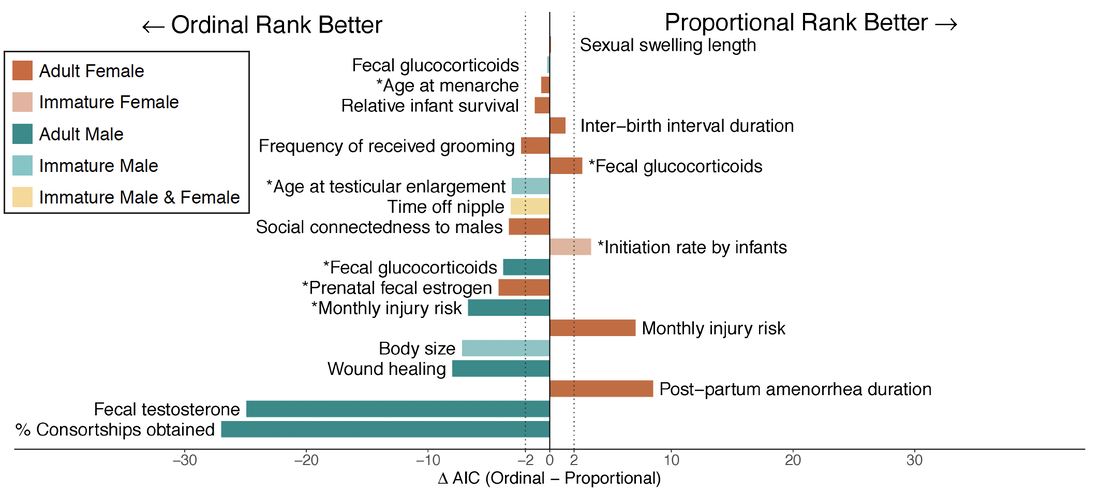
Matthew Zipple and I, along with a LOT of co-authors, wanted to further test this hypothesis that that rank metrics make different assumptions about within-group competitive landscapes. We tested the ability of ordinal and proportional rank to predict 20 different rank-related traits in the Amboseli baboons. This project was a perfect example of how powerful long-term datasets can be, and how fun science can be with excellent collaborators! See our publication here, and the results of our re-analysis below. The asterisks highlight the phenotypes that were only predicted by one of the two rank metrics - meaning we would have missed an effect if we'd used the 'wrong' rank metric.